
Chapter 5: How to Use Analytics & Reports
The Analytics & Reports section provides comprehensive insights into your app's performance, user engagement, and revenue. Access powerful AI-driven analytics, detailed metrics, and actionable recommendations to grow your audience and improve engagement.
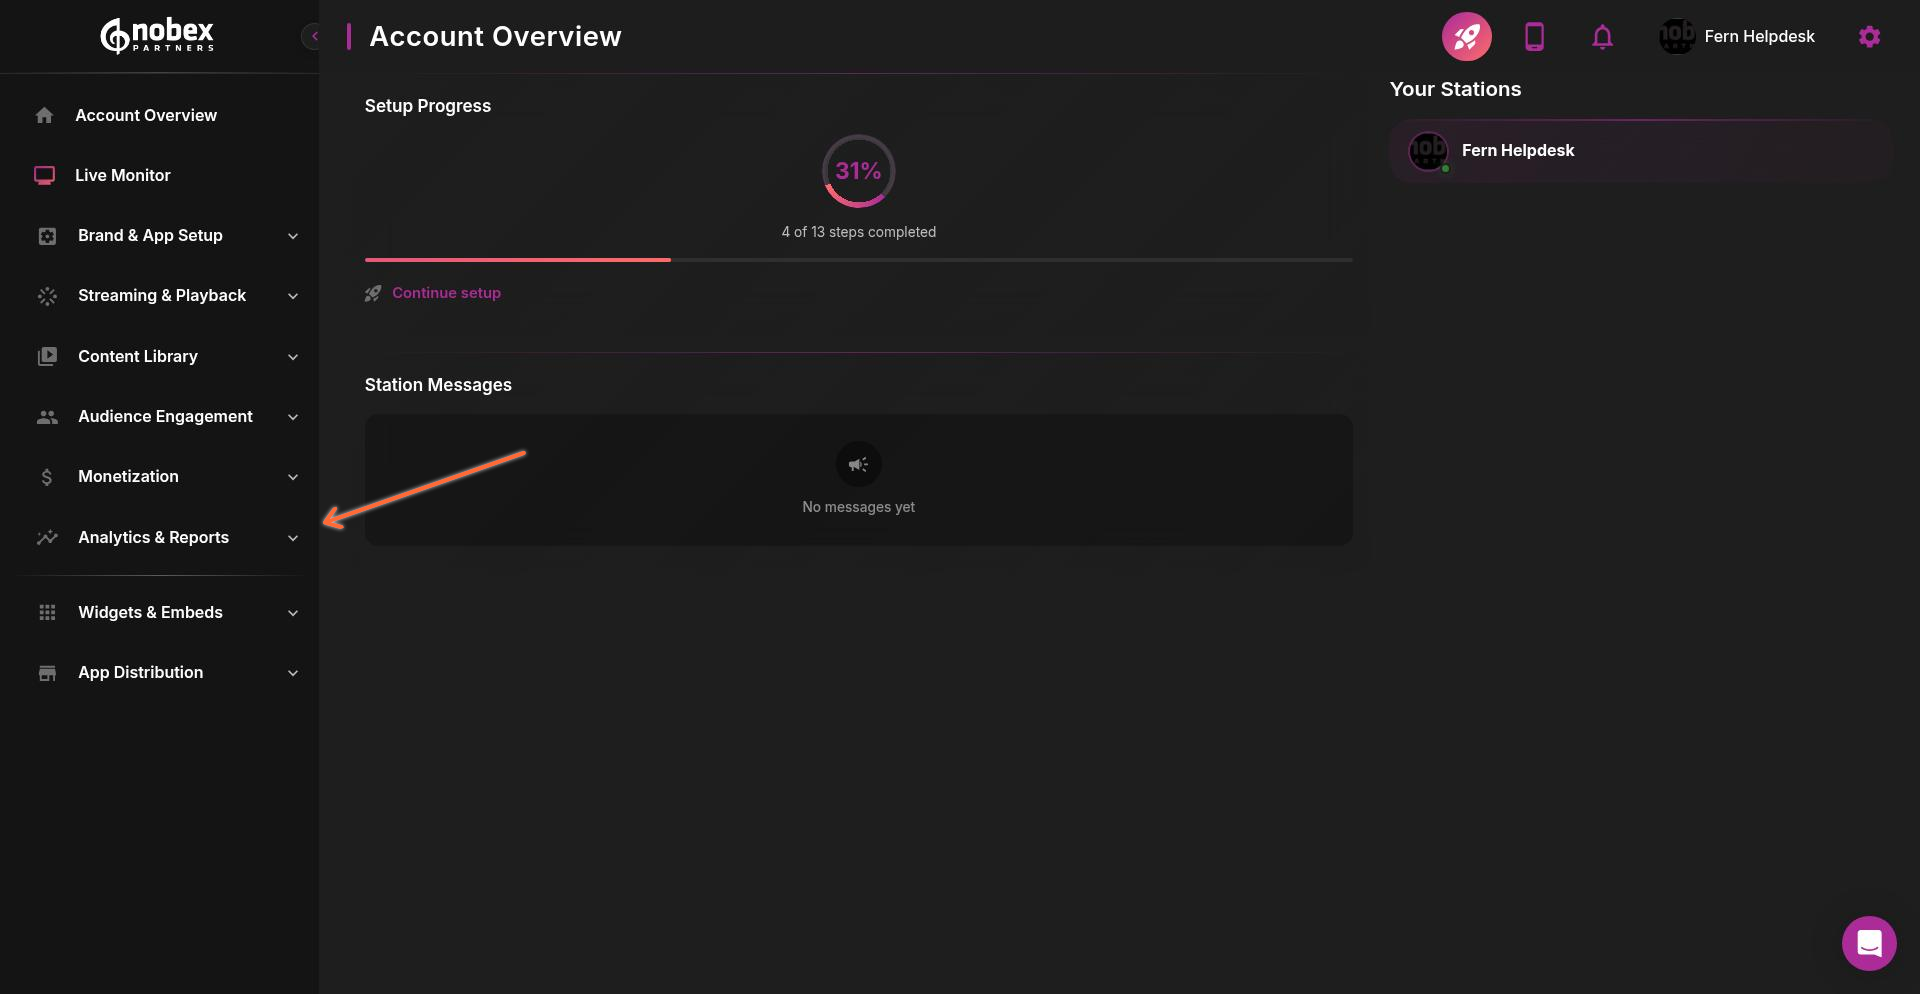
Accessing Analytics & Reports
Navigate to Analytics & Reports from the left sidebar in your admin dashboard.
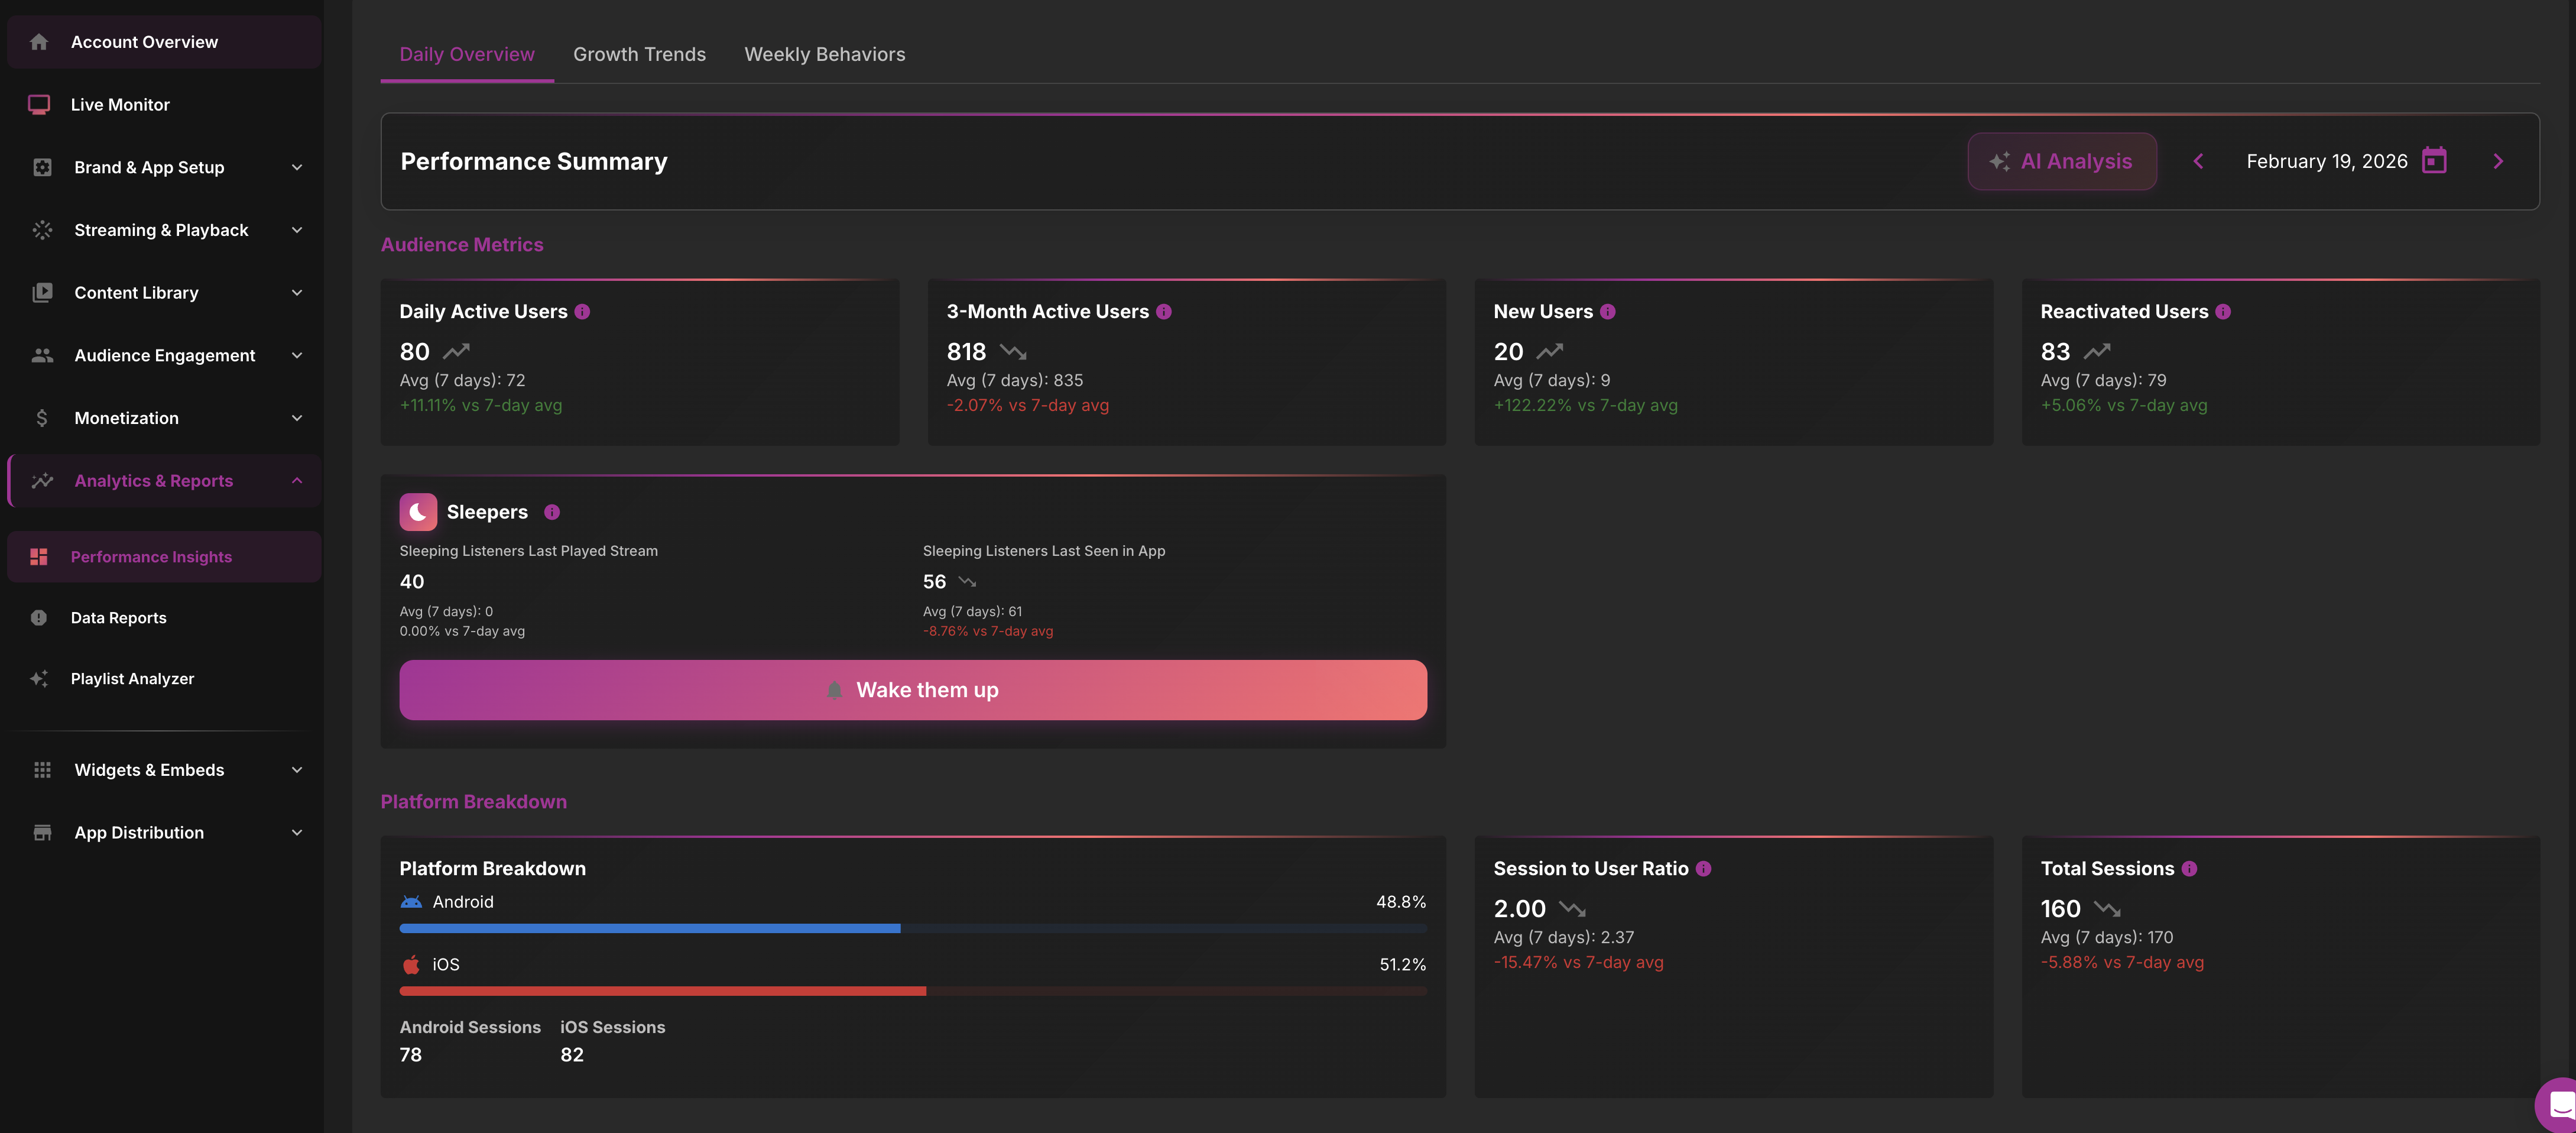
Performance Insights
The Performance Insights tab provides AI-powered analysis of your app's behavior, trends, and engagement patterns.
Performance Insights is automatically available on the Pro plan and available as an add-on for the Plus plan.
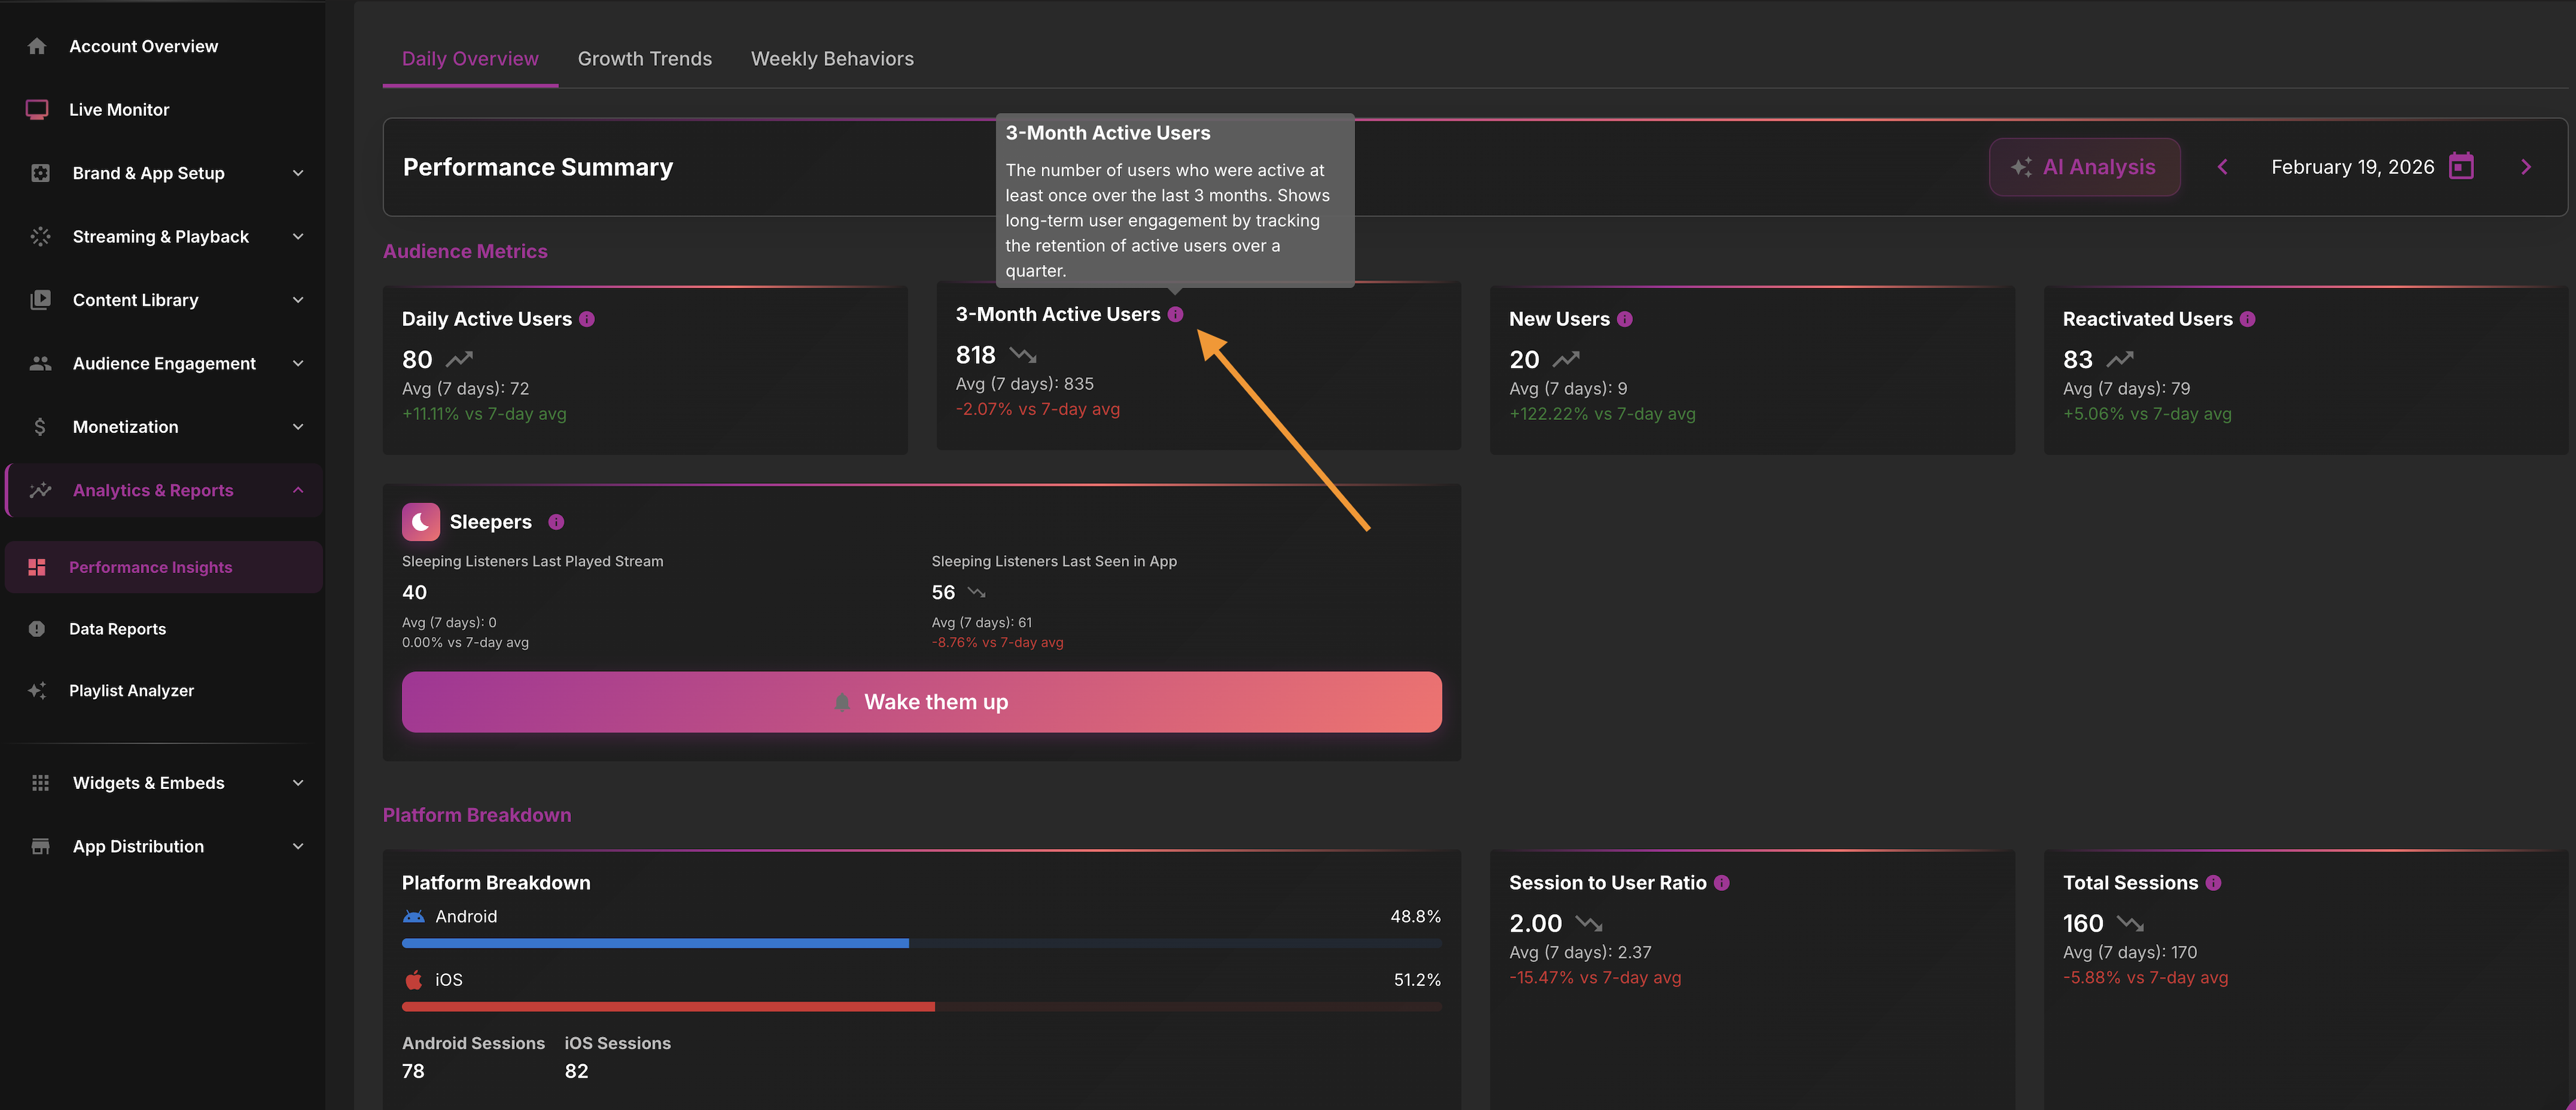
Understanding Metrics
Each metric card includes an info icon (ⓘ) that provides detailed descriptions when you hover over it. This helps you understand exactly what each metric represents and how it's calculated.
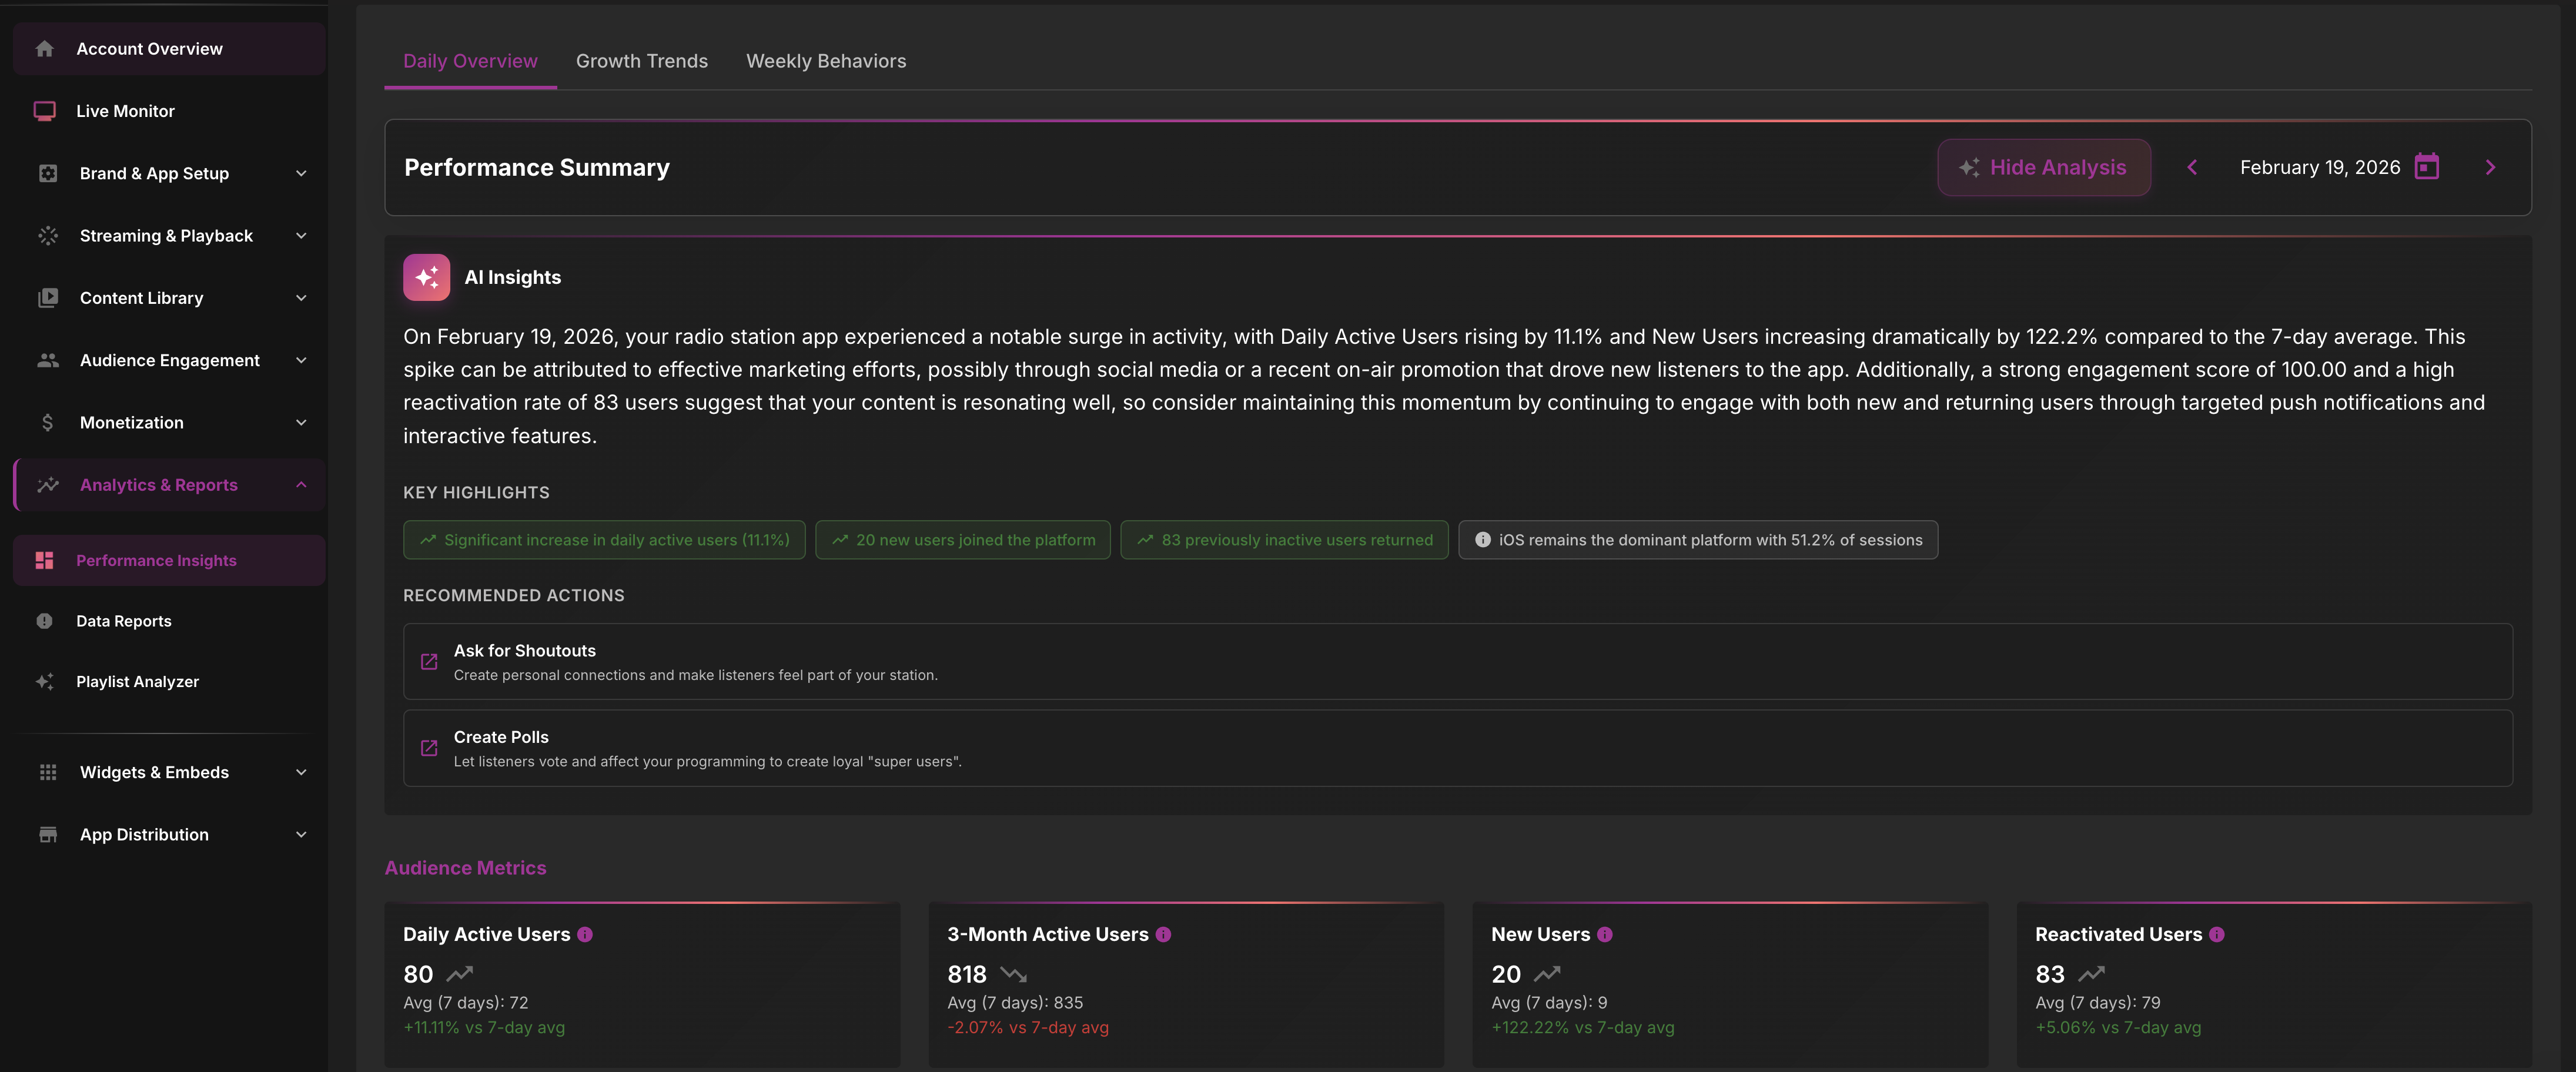
AI Analysis
Click the AI Analysis button to generate an intelligent daily report based on your app's unique performance. The AI provides insights about how your app is performing—whether you're growing your audience or increasing engagement—and makes actionable recommendations to improve app performance.
The AI Analysis generates a comprehensive report with specific insights and recommendations:
Daily Overview
The Daily Overview section displays key metrics for the selected date, including listener activity, sessions, and engagement for that specific day.
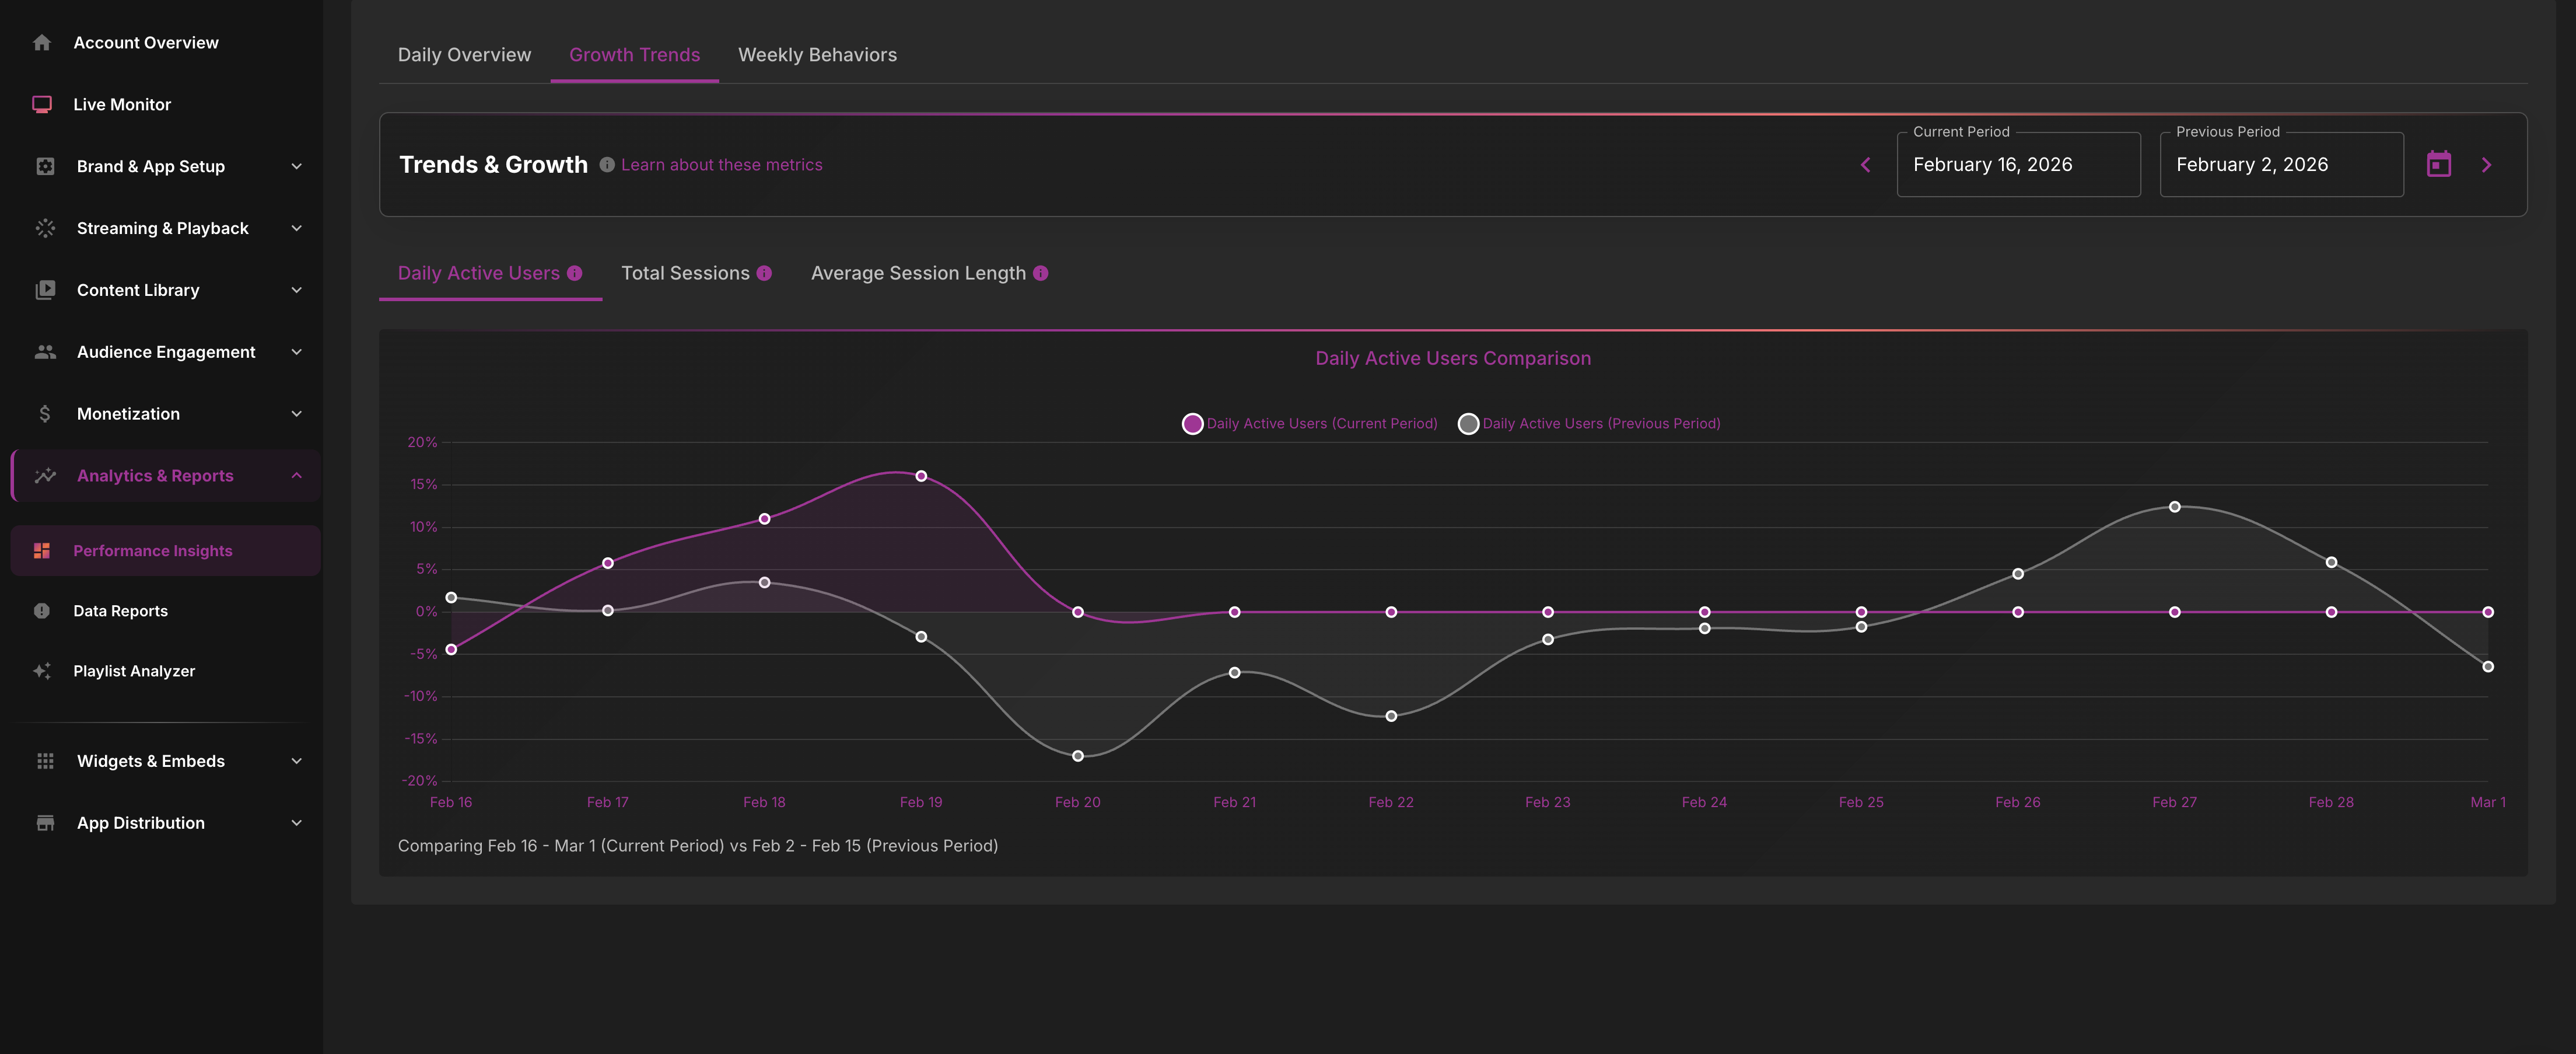
Growth Trends
Growth Trends visualizes your app's growth over time with metrics including Daily Active Users, Total Sessions, and Average Session Length. Use the date range selector to analyze specific time periods.
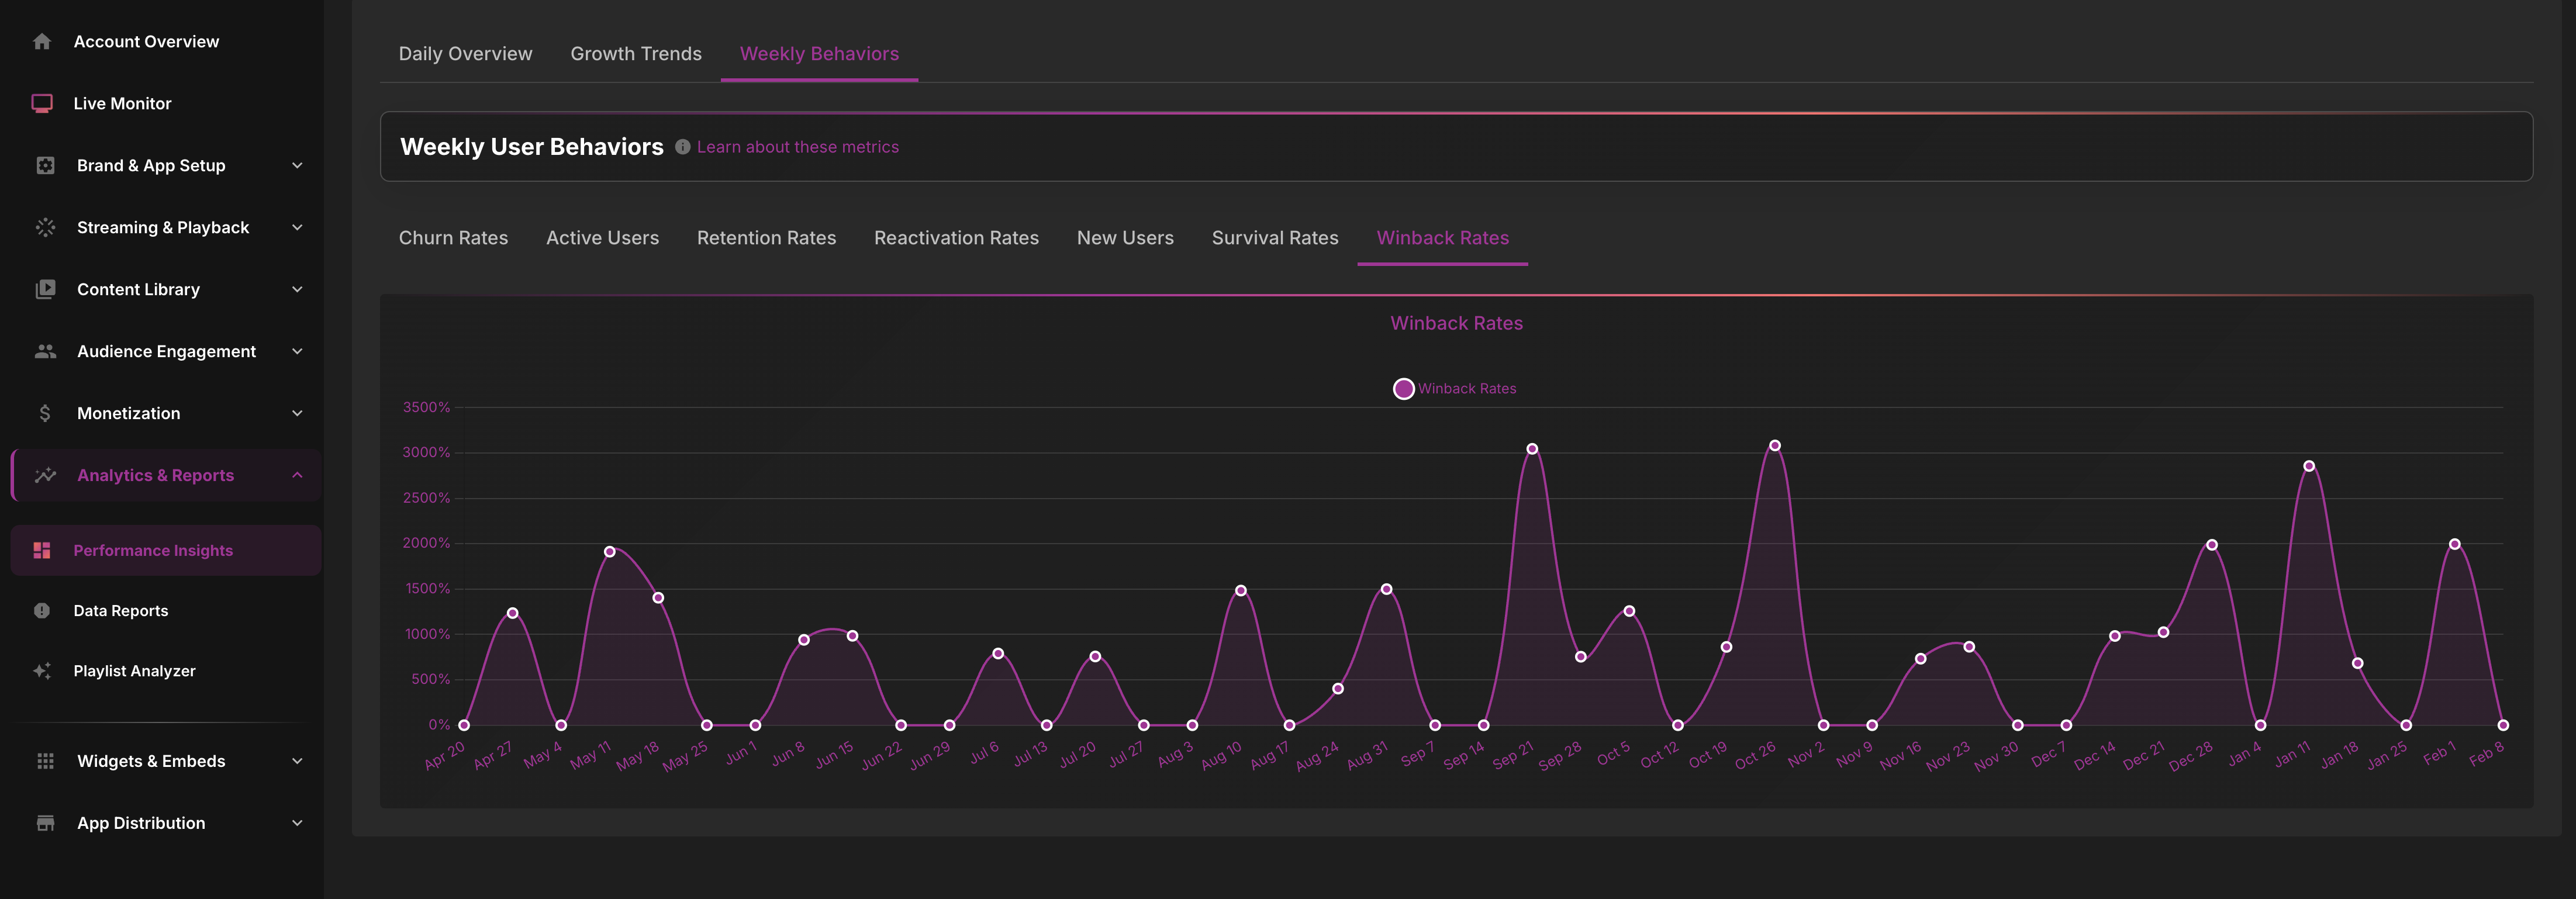
Weekly Behaviors
Weekly Behaviors shows user patterns throughout the week, including churn rates, active user trends, and behavioral patterns that help you understand when and how users engage with your app.
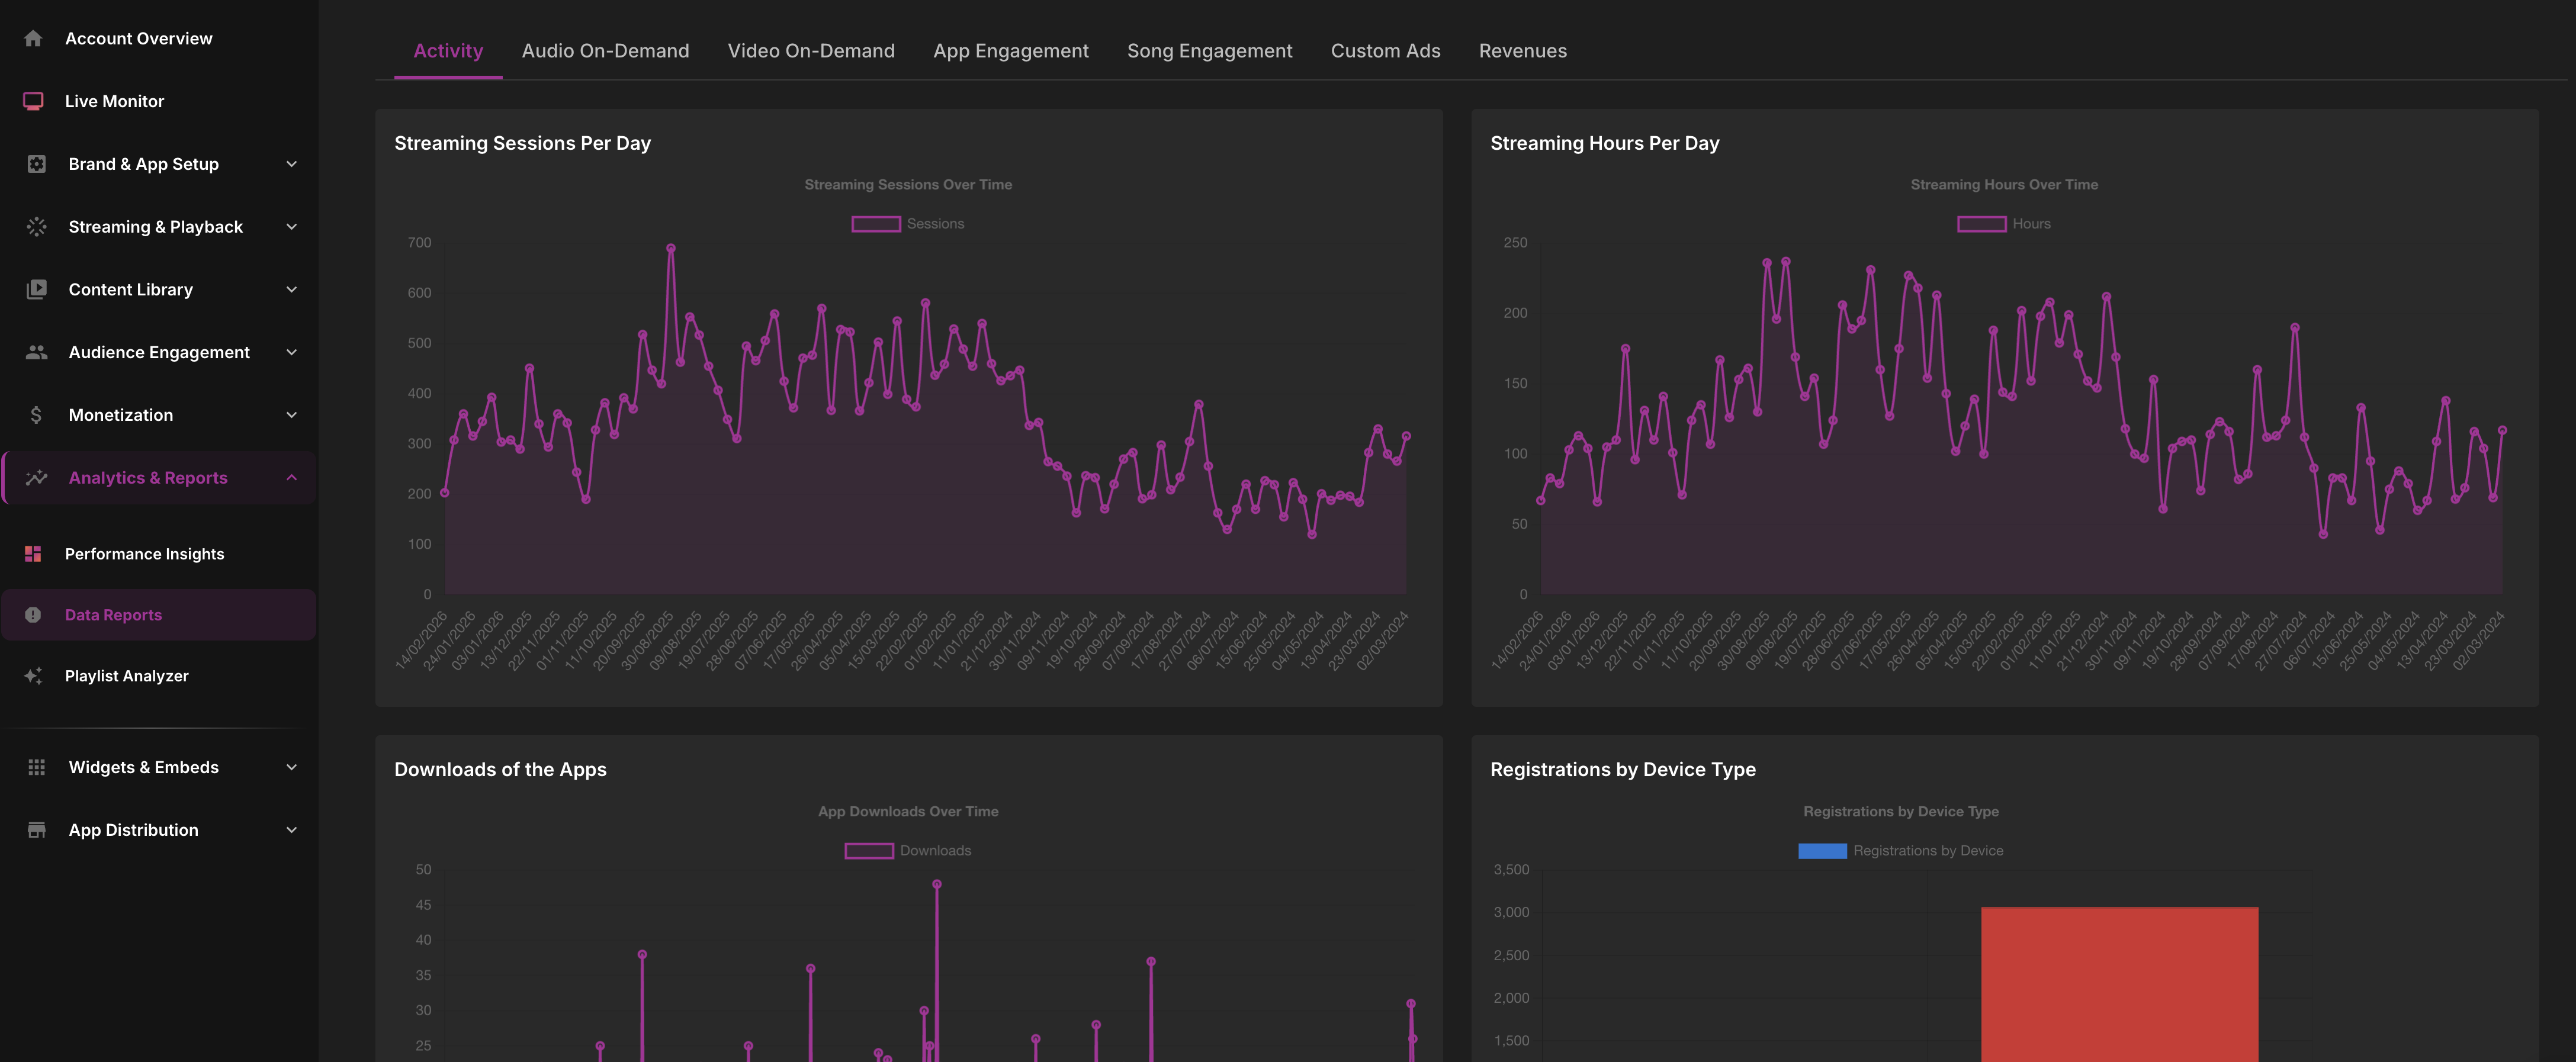
Data Reports
The Data Reports tab provides detailed analytics across multiple categories. Each section includes graphs, metrics, and exportable data to help you understand your app's performance.

Activity Reports
Activity reports track listener activity, sessions, and active user counts. These metrics show how many people are using your app and how frequently they engage.
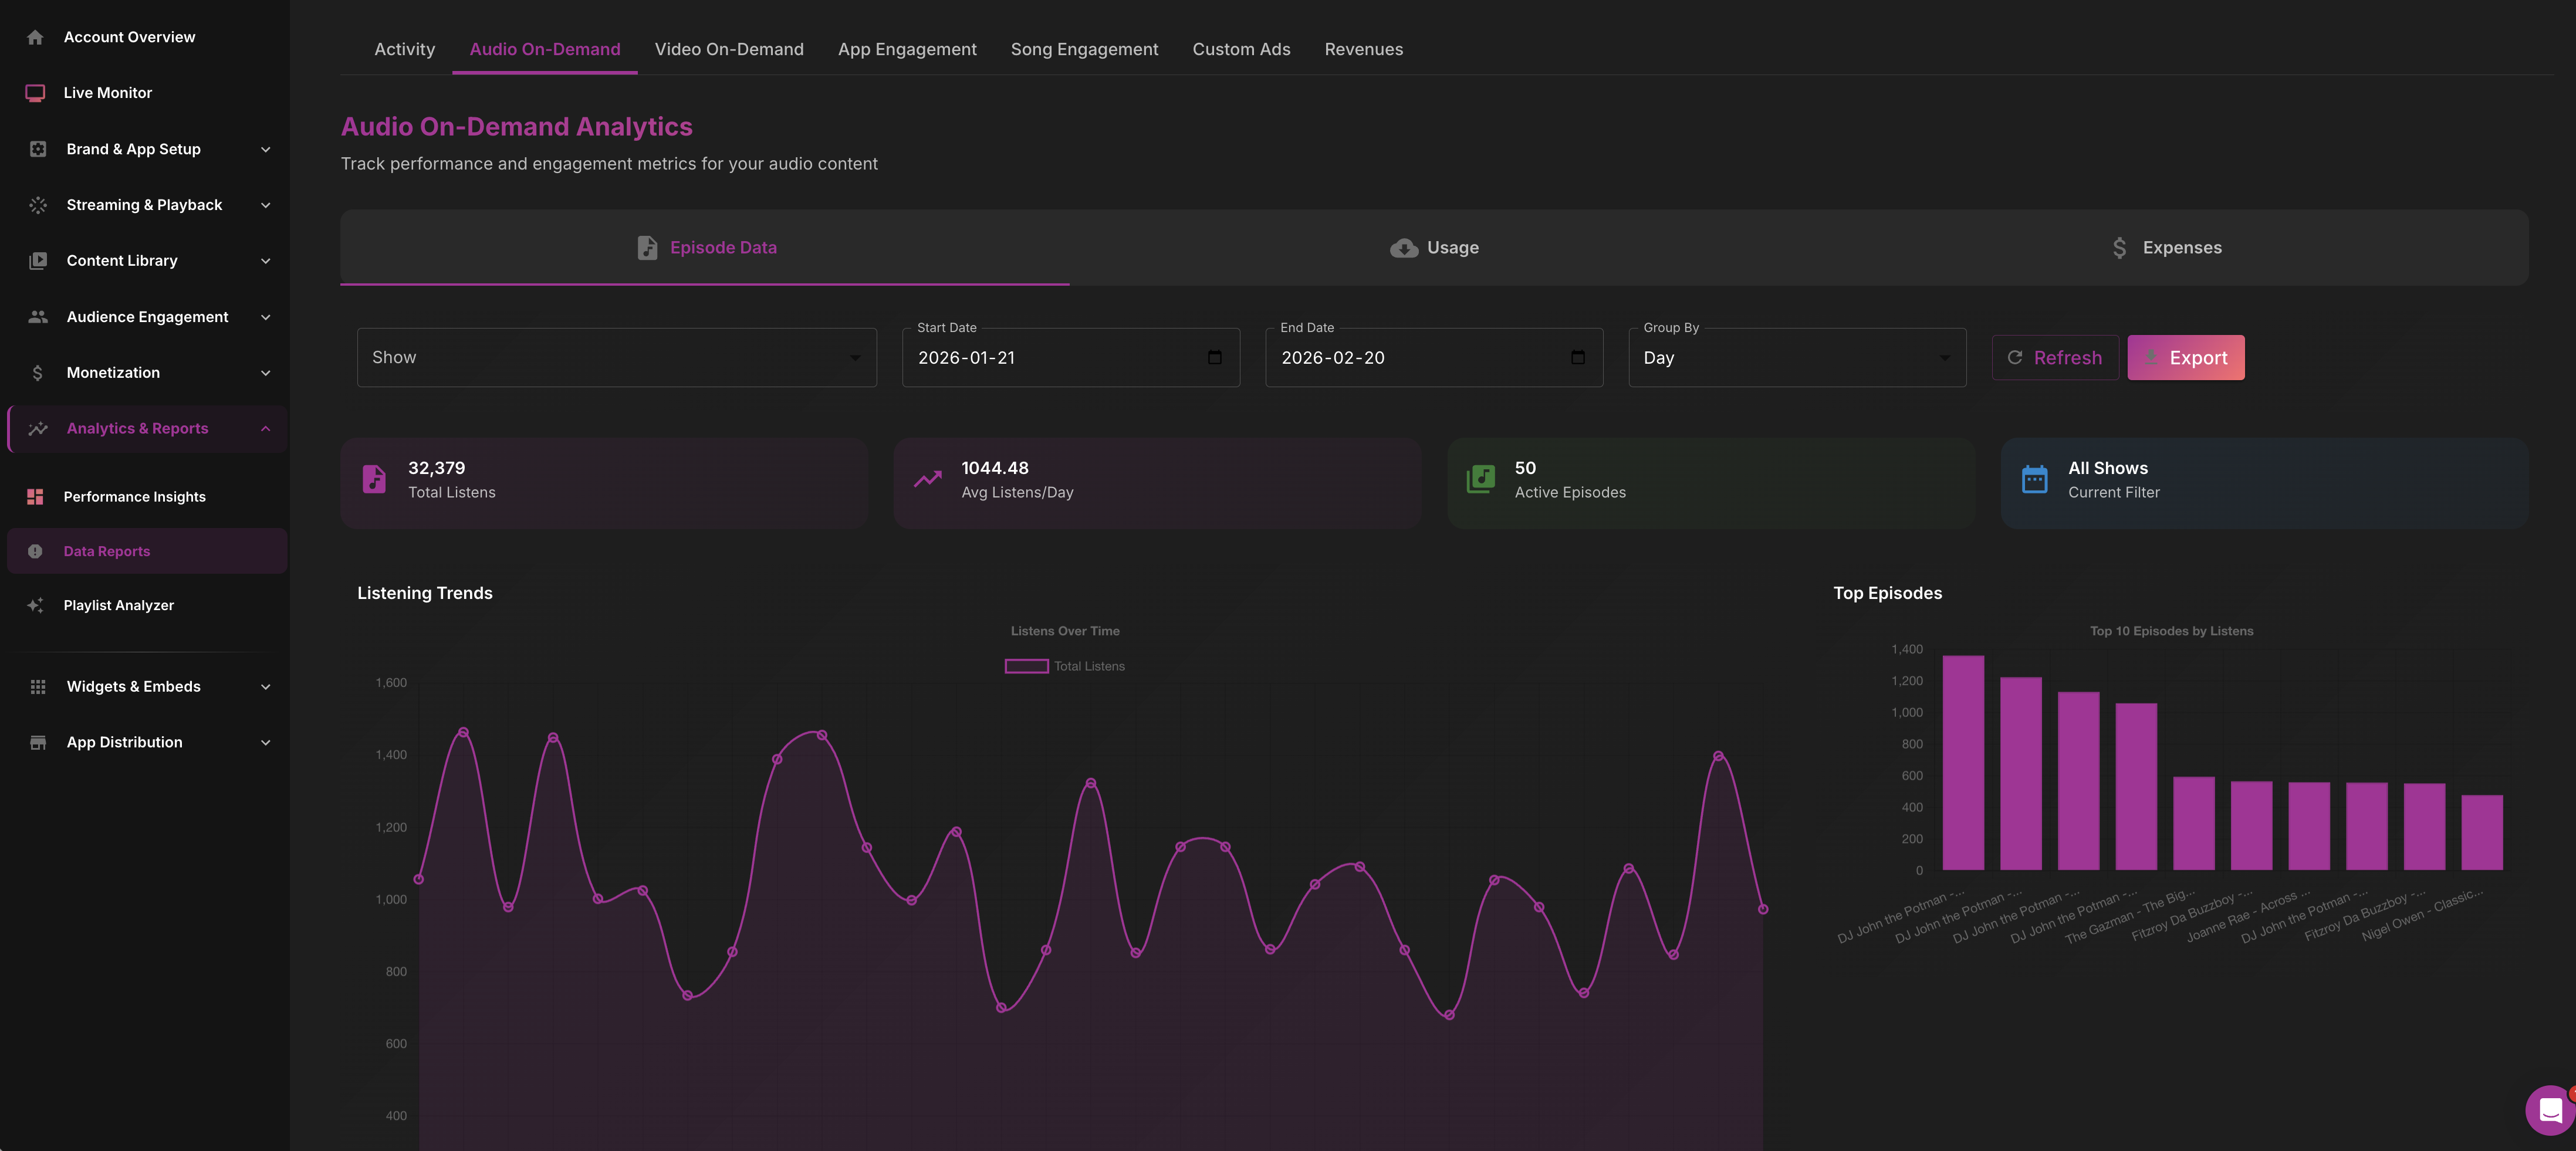
Audio On-Demand Reports
Audio On-Demand reports display plays, completion rates, and drop-off points for your podcast and on-demand content. Use this data to understand which episodes resonate with your audience.
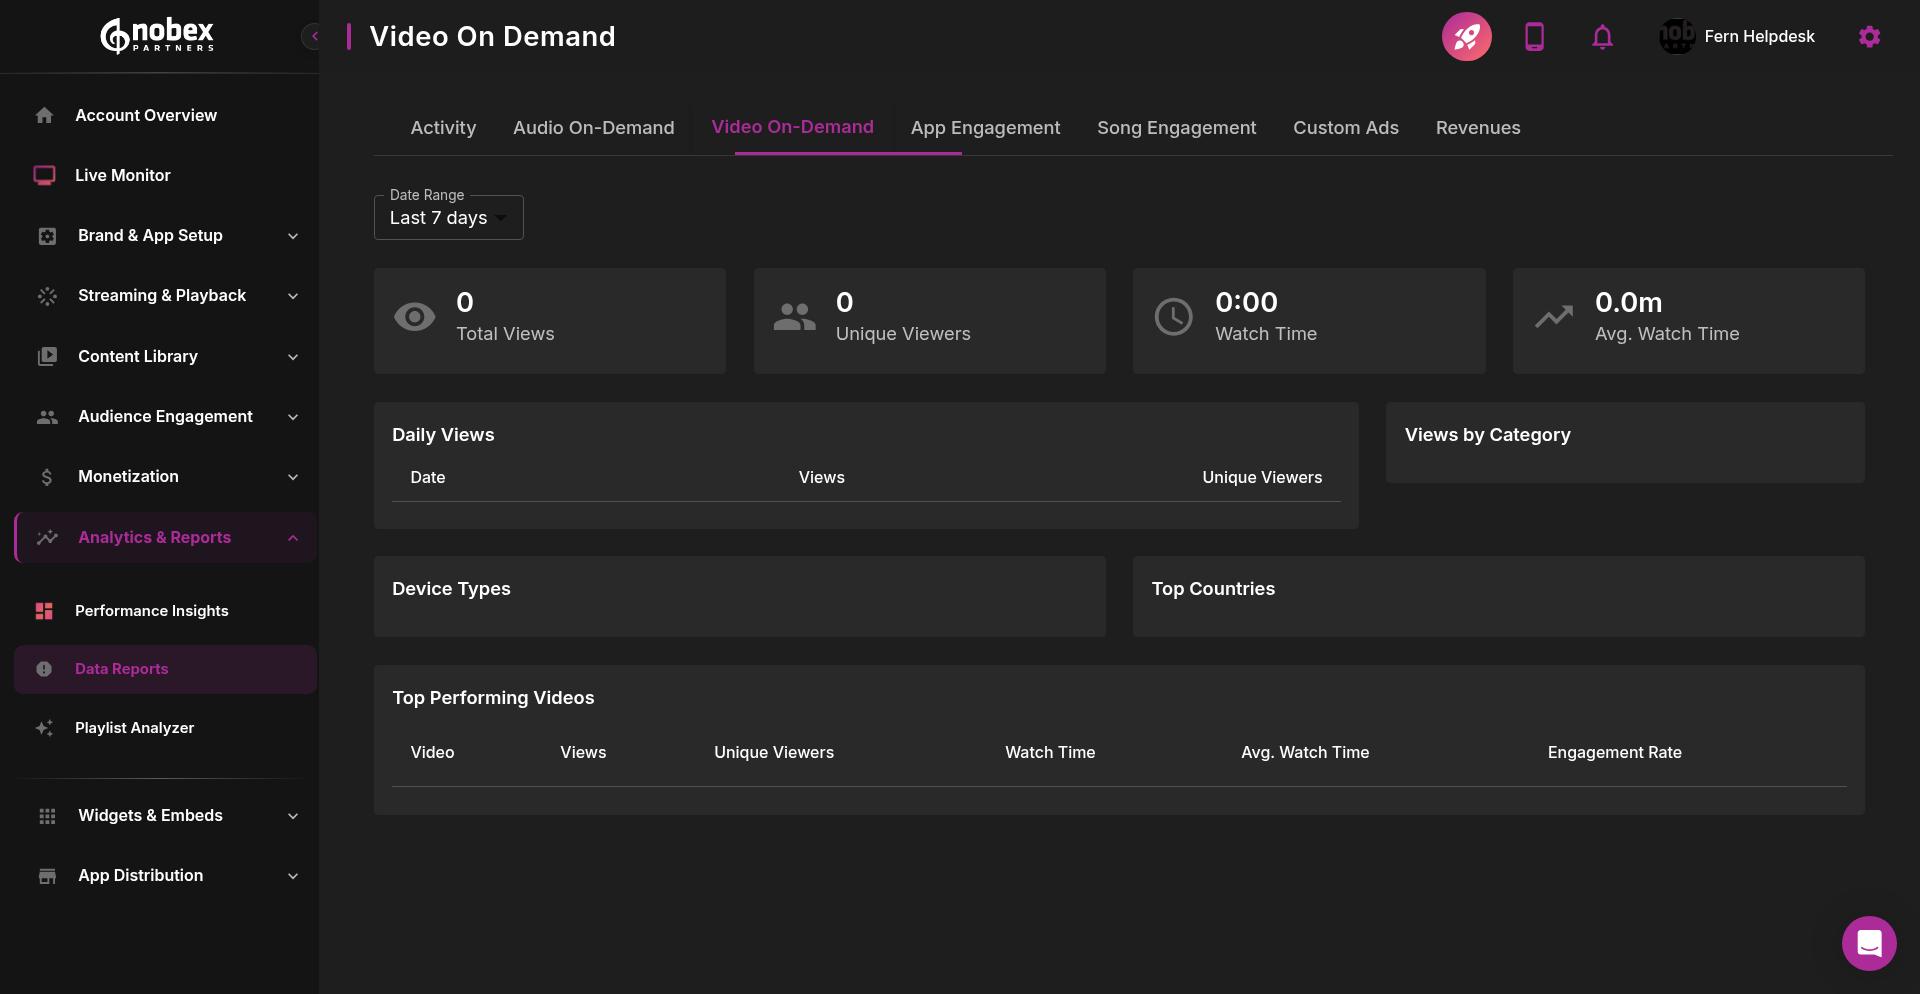
Video On-Demand Reports
Video On-Demand reports show views and engagement metrics for your video content, helping you track video performance and viewer behavior.
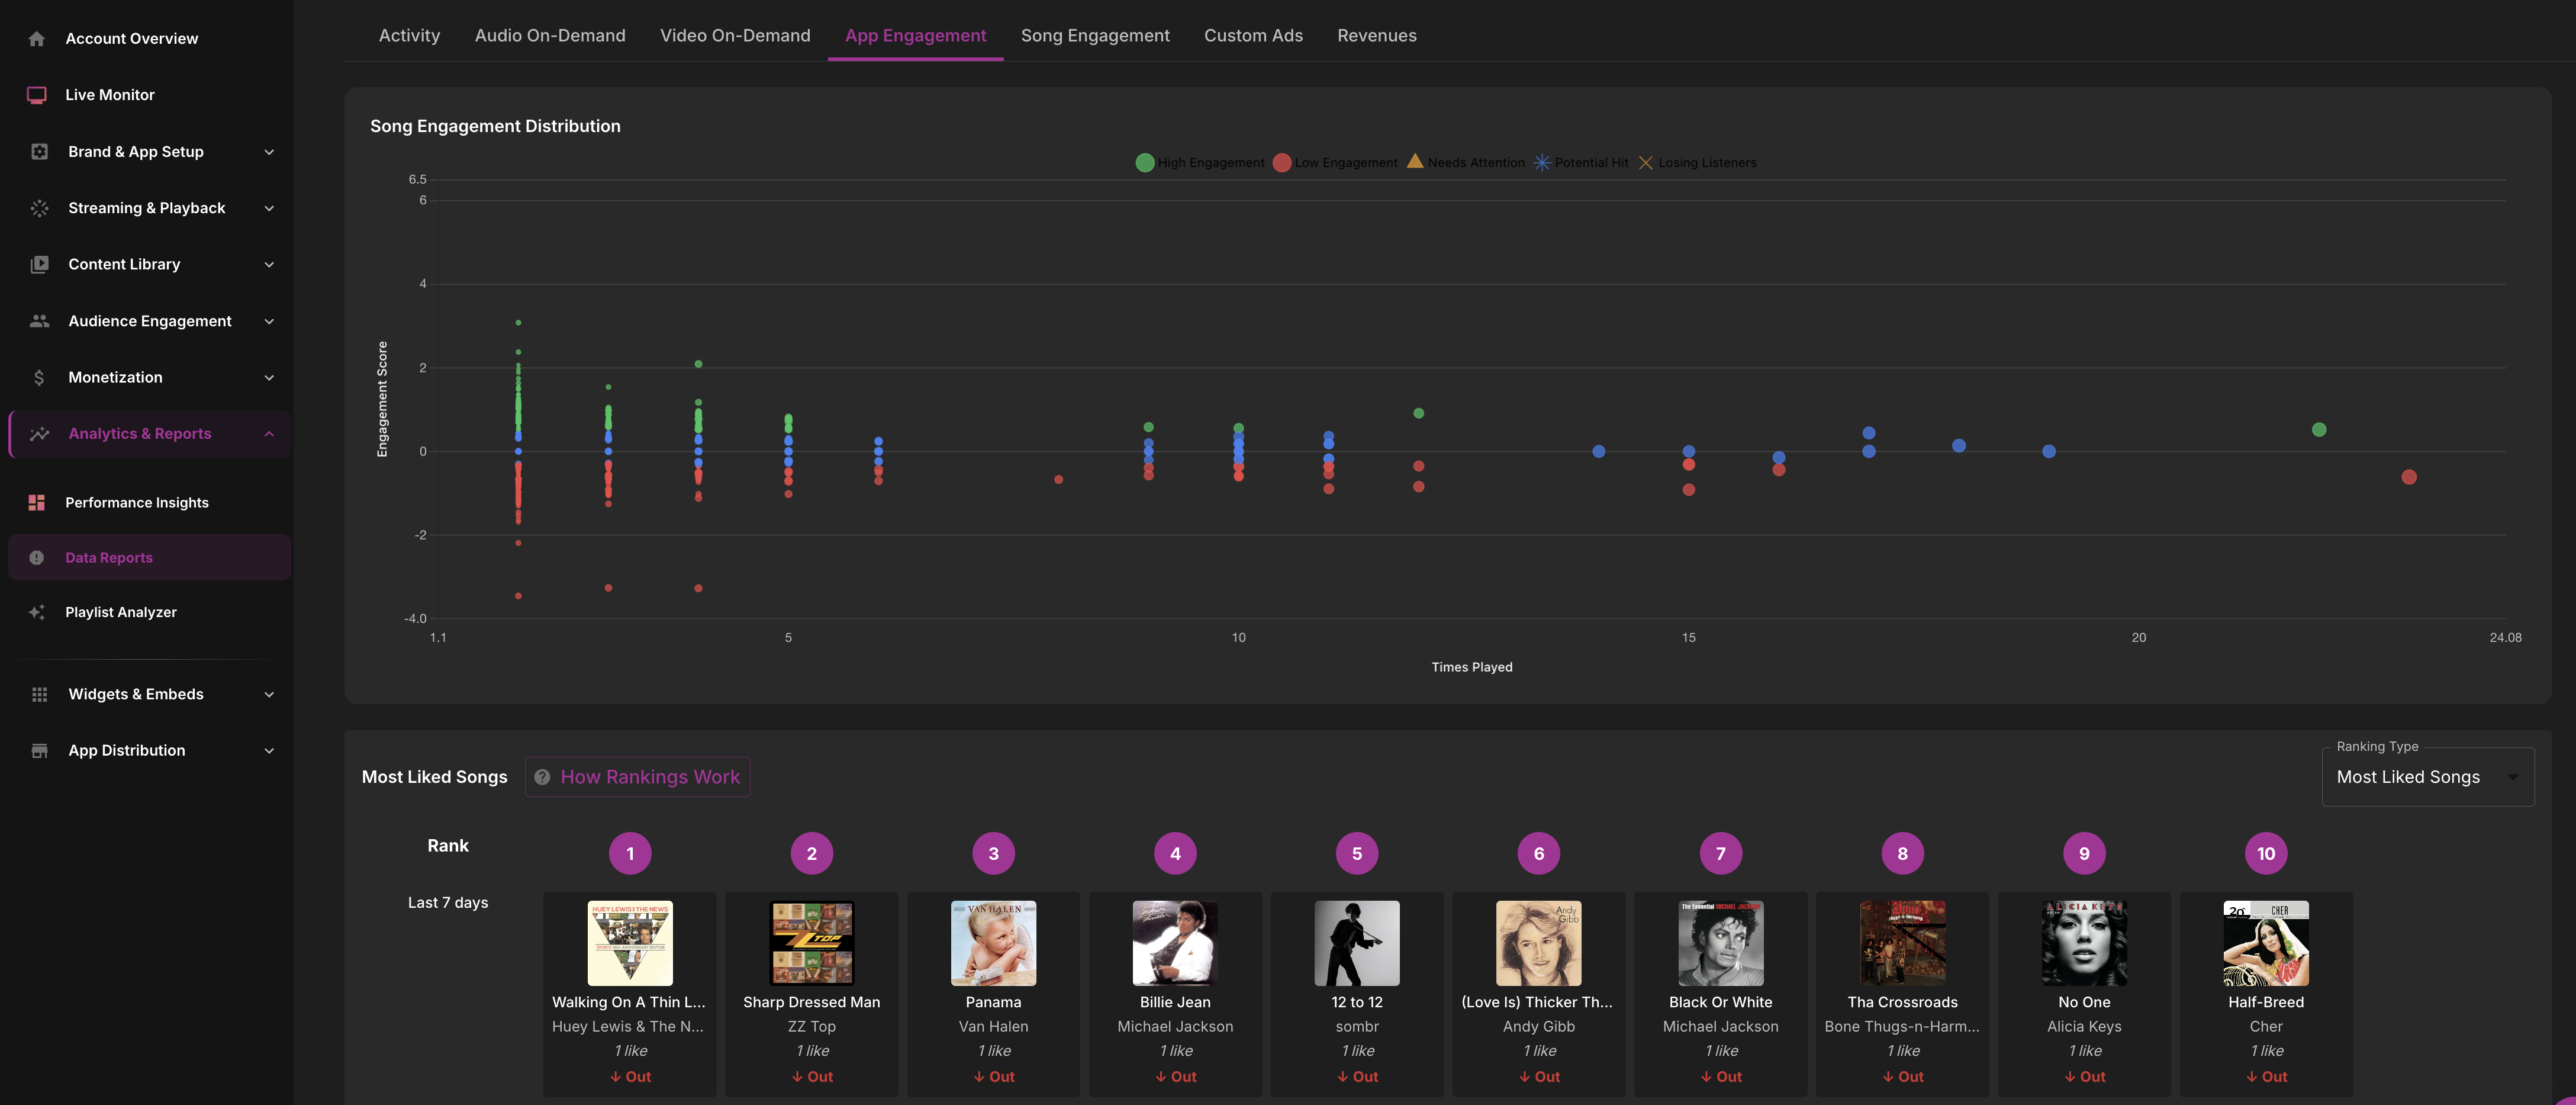
App Engagement Reports
App Engagement reports include Daily Active Users (DAU), Monthly Active Users (MAU), retention rates, feature usage, and cohort analysis. These metrics help you understand how sticky your app is and which features drive the most engagement.
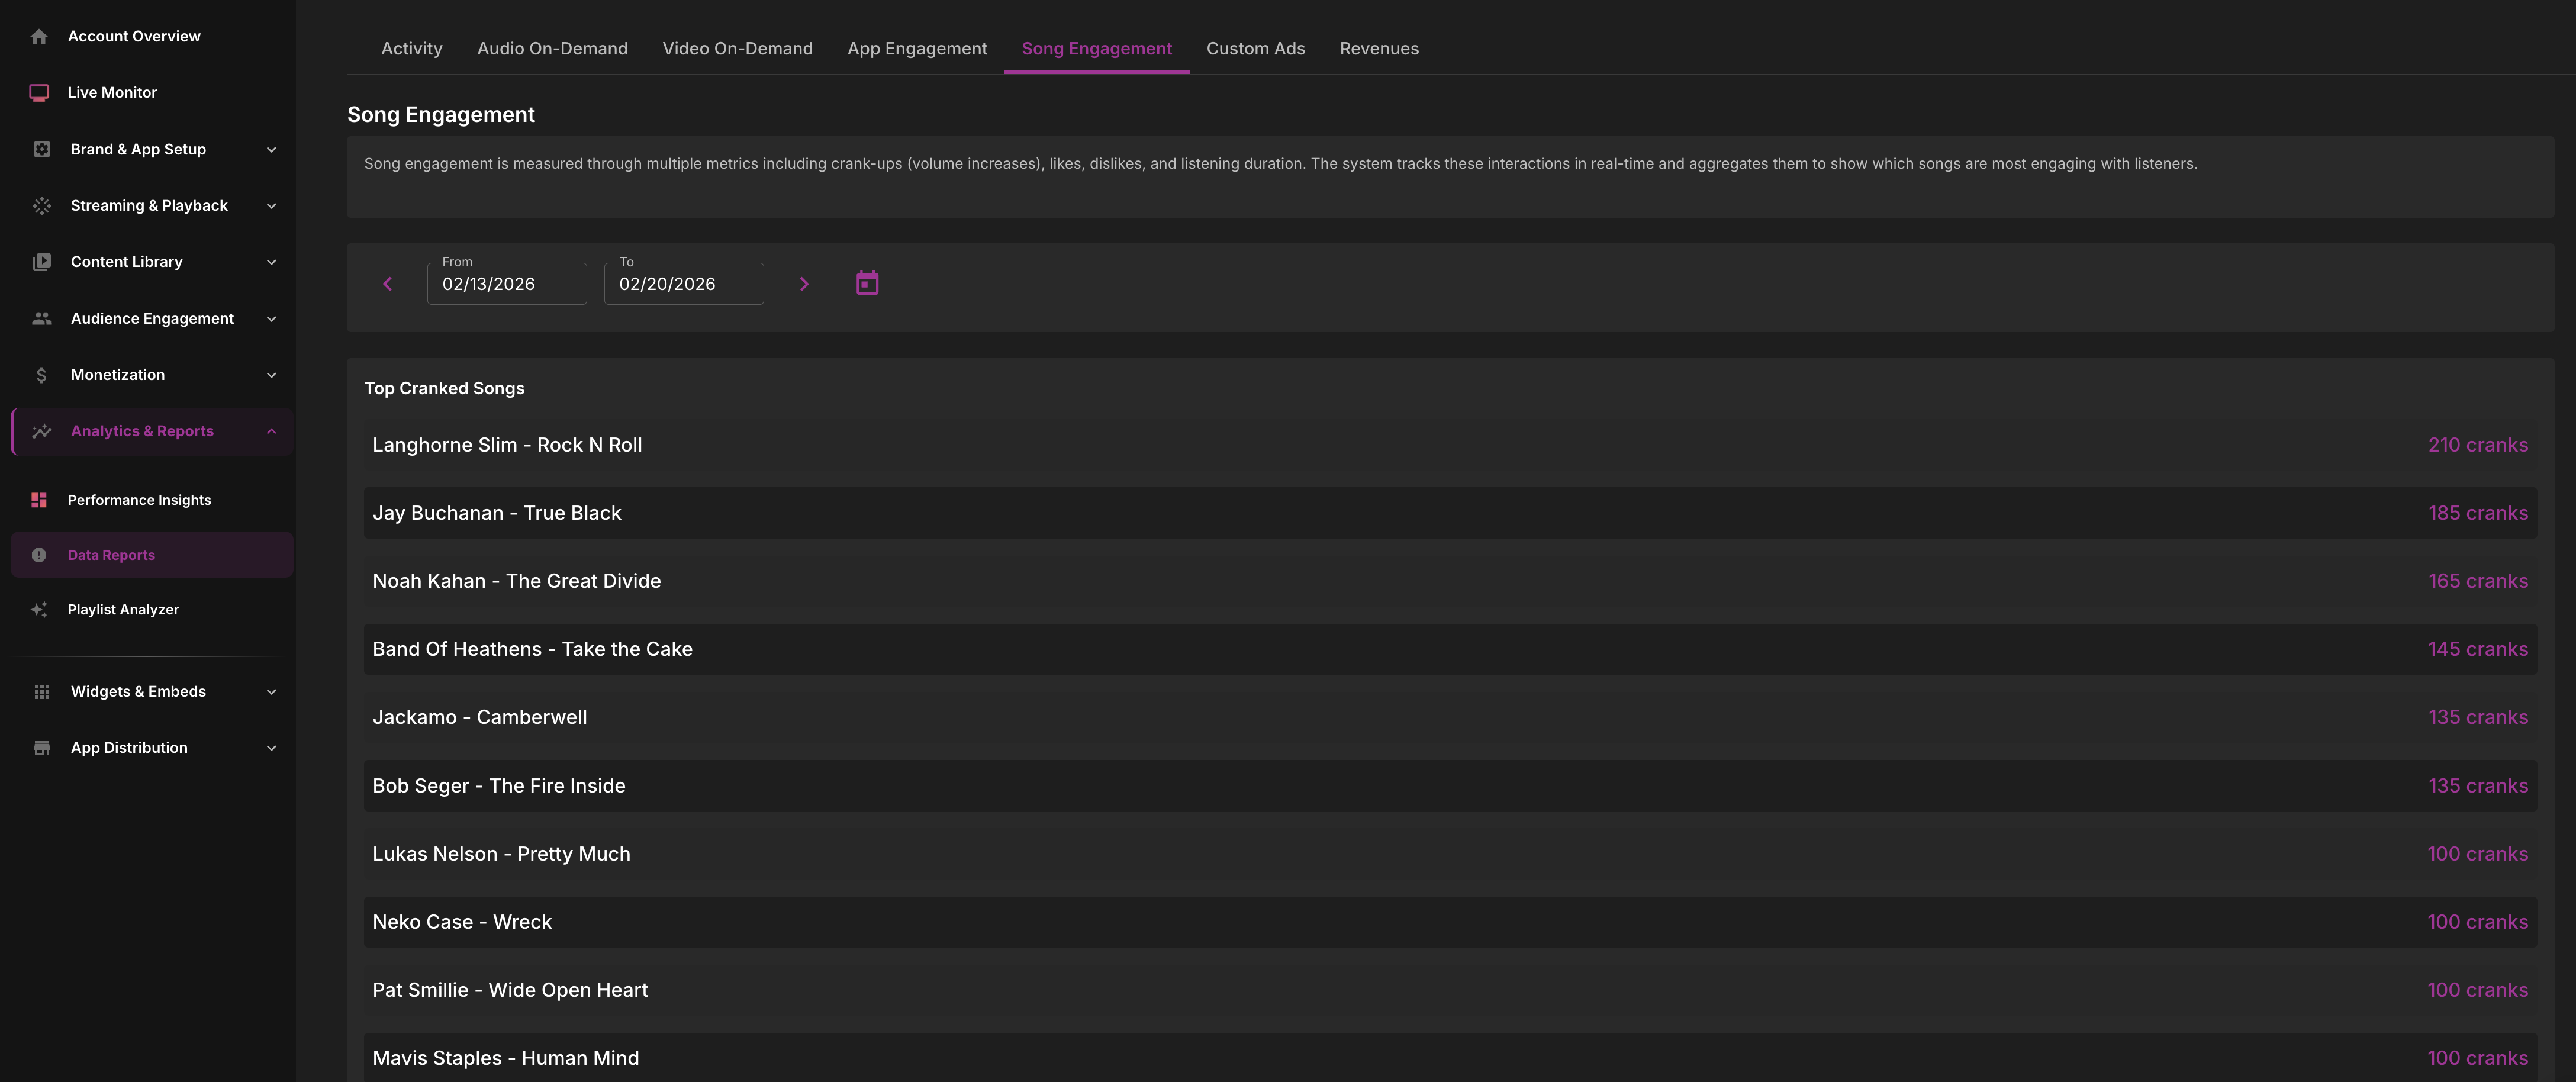
Song Engagement Reports
Song Engagement reports show listeners per song, tune-in and tune-out patterns, skips, and song requests. This data reveals which songs drive the most listener engagement and helps optimize your playlist strategy.
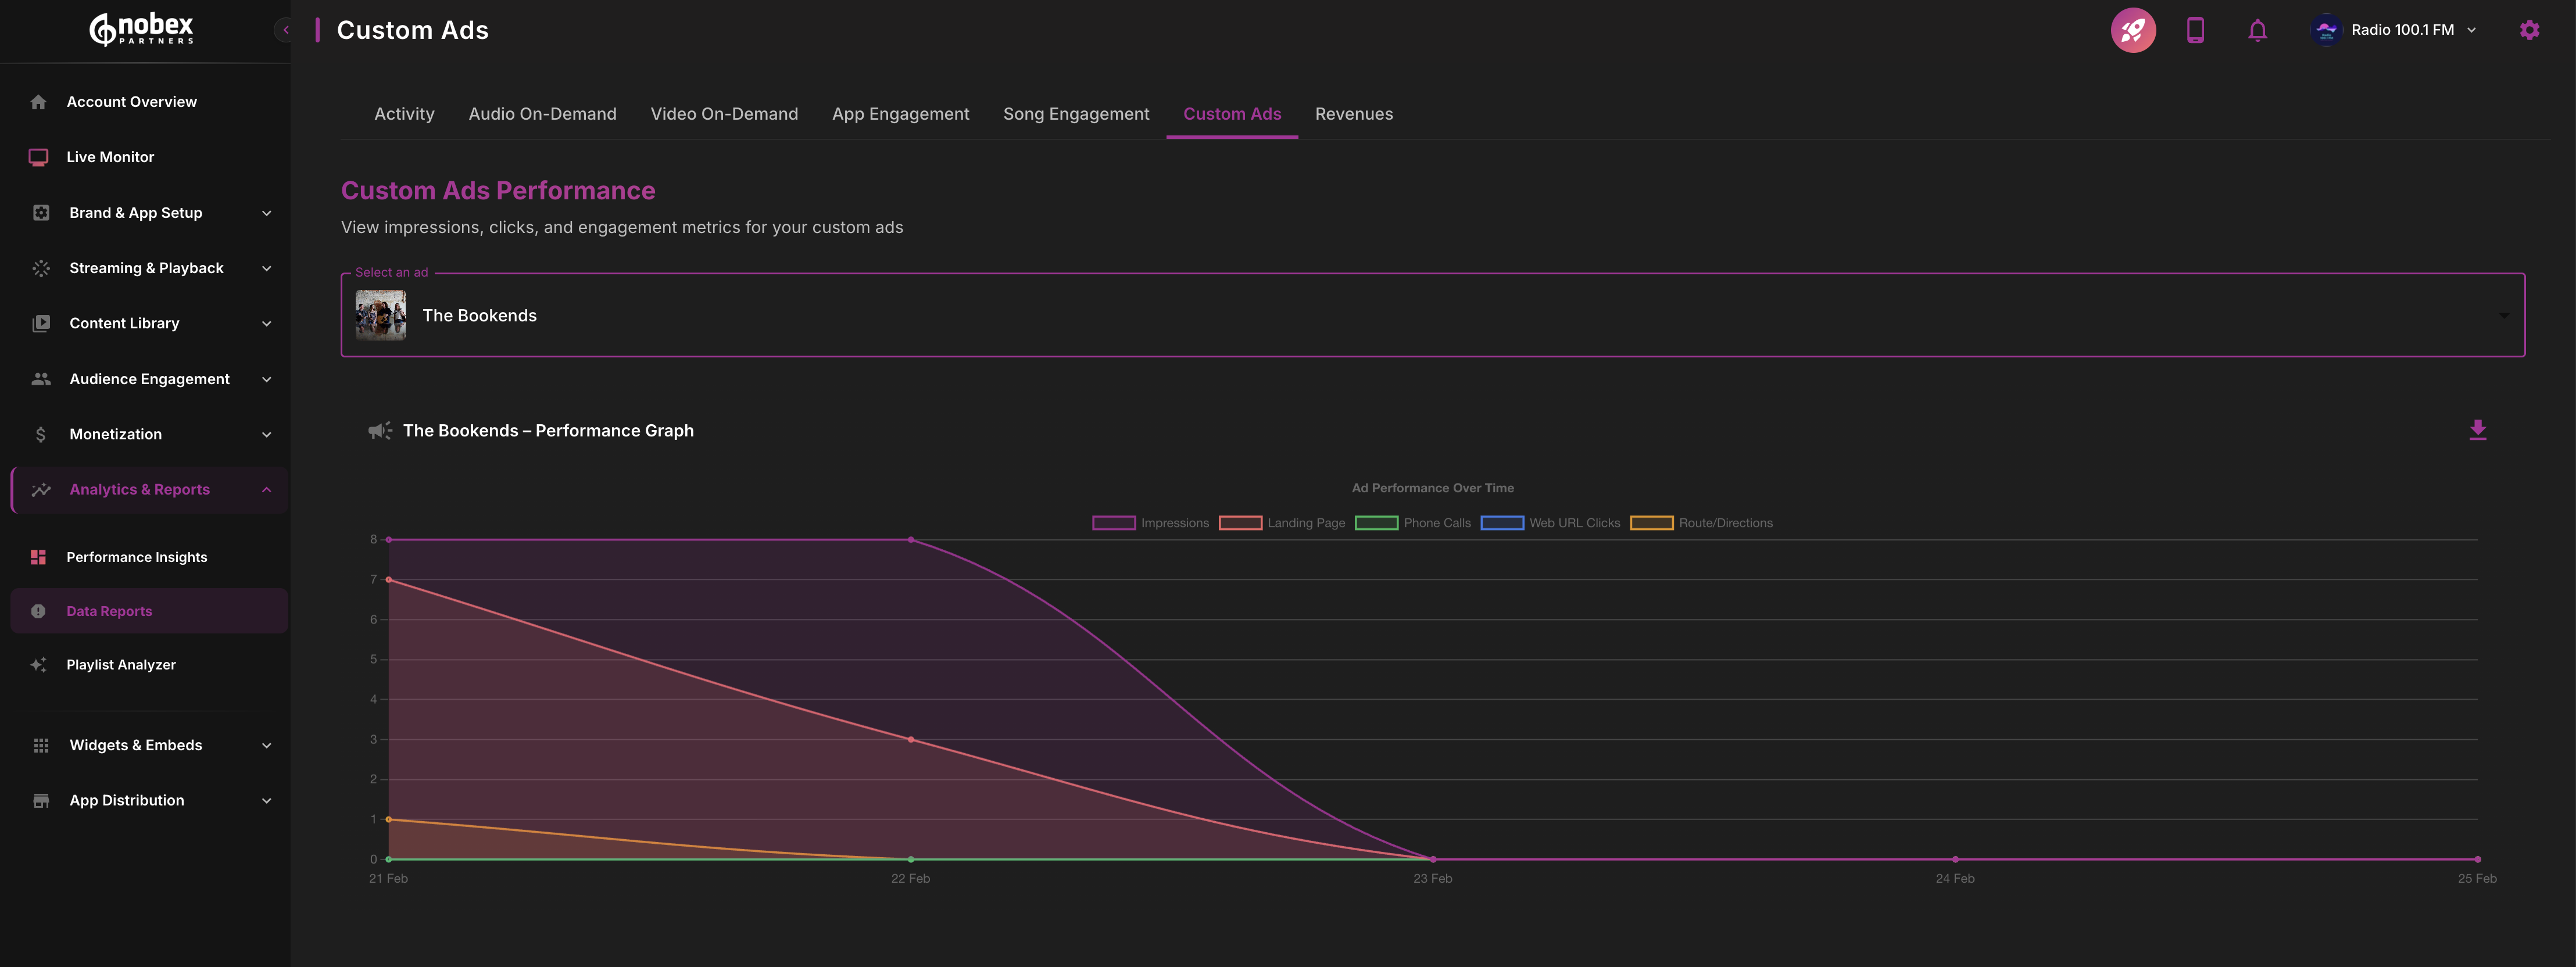
Custom Ads Reports
Custom Ads reports track impressions and revenue from directly sold advertisements integrated into your app.
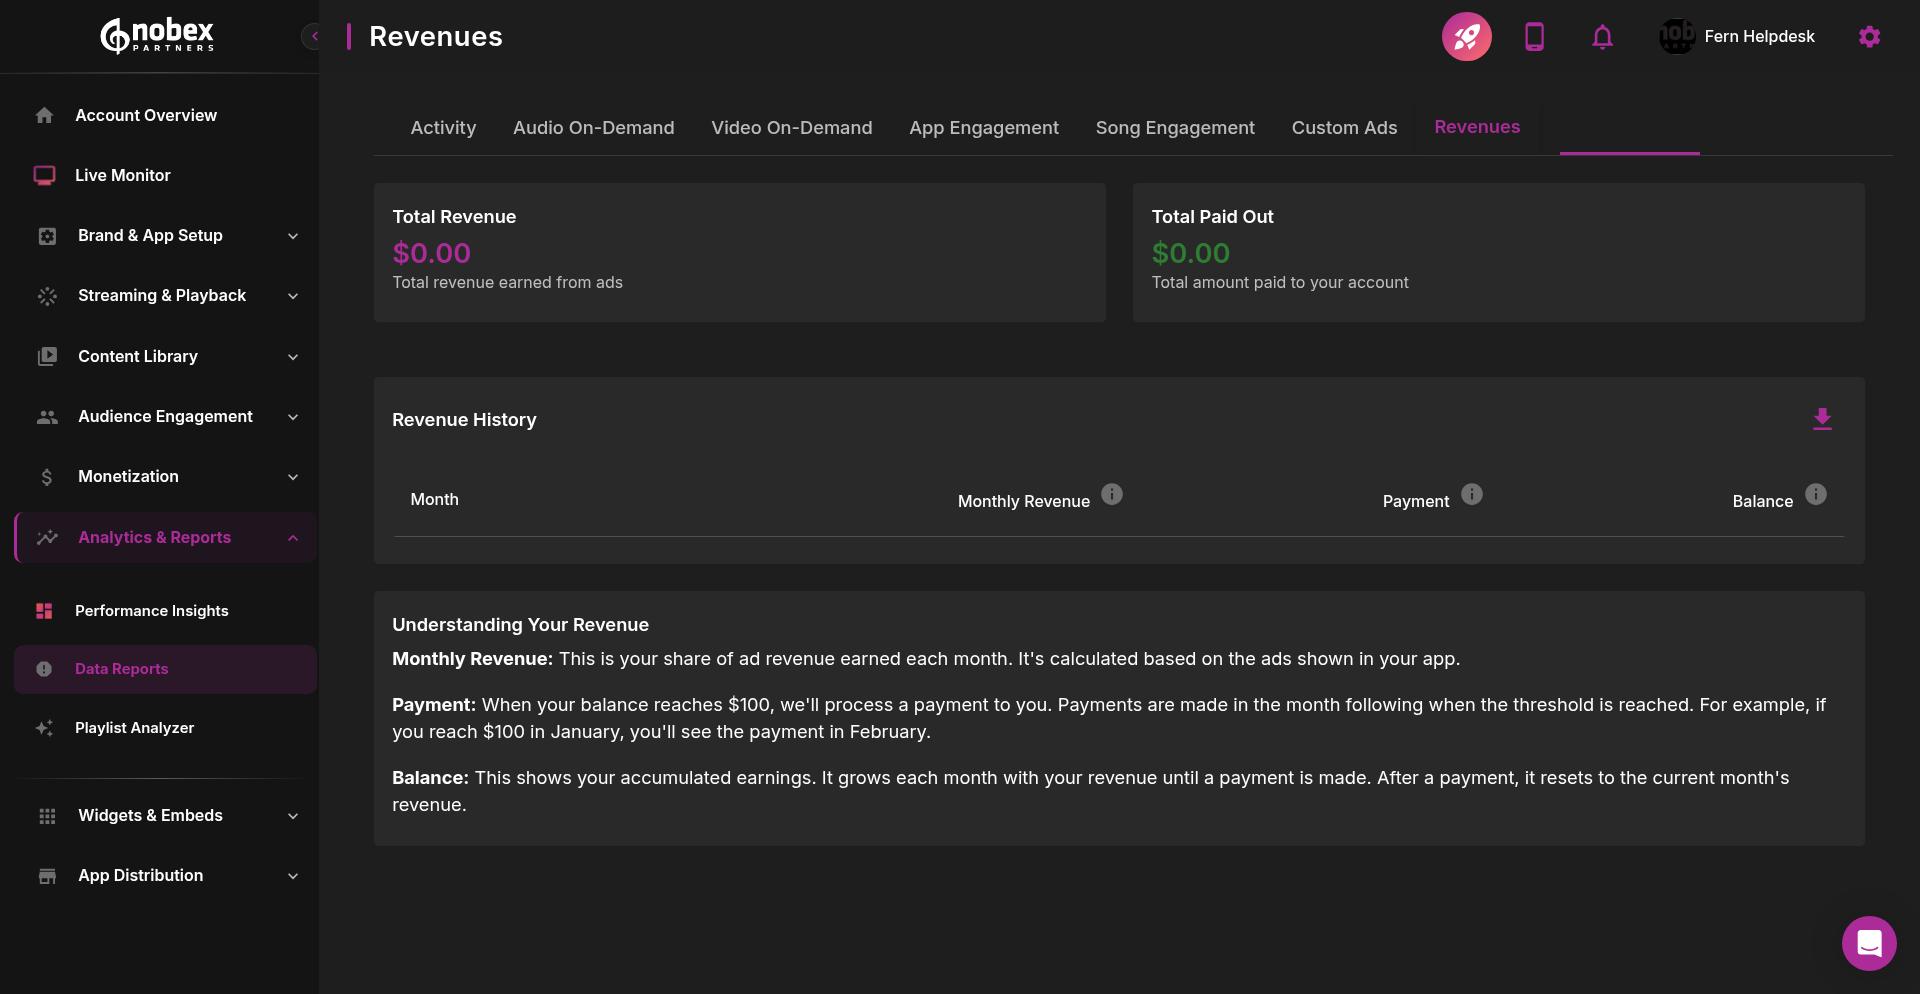
Revenues Reports
The Revenues tab is only visible for stations that participate in the Revenue Share program, where ads are displayed in-app using Nobex Partners' own Google Ad accounts with revenues shared 50/50.
Revenues reports display total revenue, and payouts. Track your monthly earnings and running balance here.
Exporting Data
All Data Reports support date range selection, CSV export, filters by platform and geography, and comparison views. Use these features to analyze specific time periods and export data for further analysis.
For real-time analytics, check out the Live Monitor Dashboard which complements these reports with live graphs, listener maps, and AI-powered suggested actions.